Double dipping into surplus value: Market exchange and exploitation
Using the Canadian Income Survey to achieve a fuller measure of exploitation
 Double dipping into surplus value – generated with Microsoft Copilot Image Creator
Capitalist exploitation might begin in the workplace, but it certainly does not end there. If capitalism is the society of generalized commodity production – where everything increasingly exists as a commodity to be bought and sold – then it is also the society of generalized exploitation, which increasingly pervades every corner of society. If exploitation can also happen outside of the workplace, any measure of class should try to take this into account.
Our previous analysis used employment data from the Labour Force Survey (LFS) in combination with the monetary equivalent of labour time (MELT)1 to measure the degree of exploitation in paid employment. This time around, we’ll use data from the Canadian Income Survey to do a similar analysis, but using a fuller concept of income.
In practice, people have many sources of income beyond paid employment. In particular, income from property ownership, crucial to understanding the economic dimensions of social class, has not yet been accounted for. To move forward, a more holistic concept of income is needed – one that can account for the fact that some people are able to reap surplus value through market exchange, while other people lose value through it.
Circulation and exchange are central to exploitation
Exploitation, at least in the first instance, is something that happens in the realm of production, where economic value is created. Surplus value, the raw material of profit, can only ever be created by exploitation of workers through the wage labour relationship. As workers are compelled to perform surplus labour, producing goods and services for the capitalist class, those commodities can be sold for a greater sum of money than the cost of production.
For that surplus of value to be enjoyed by the owners of capital though, it has to be converted into a sum of money through sales, i.e. market exchange. Once in money form, as we all know, value can move freely in the realm of circulation, moving from one person, account, region or even country to another with ease. If the essence of exploitation is acquiring value created by the work done by others, then market exchange and circulation are essential to the process.
Once realized in the form of revenue, the proceeds of exploitation circulate into the hands of the owners of capital, commonly through payment of shareholder dividends – a mechanism for the upward redistribution of surplus value produced by workers to capital owners throughout the world. Shareholders are also compensated for their investments indirectly, by the rising value of their business assets, which they can cash in by way of capital gains, meaning profit from the sale of assets or property that have increased in market value.
Circulation isn’t just a way of redistributing profits created by labour. It is also possible for exploitation to happen through market exchange. We tend to assume that most exchanges in a market economy are done fairly – that in general, most of the time, buyers get what they pay for and sellers receive fair value in return.
Yet in reality, unfair and unequal exchange happens all the time, where one party in the buyer-seller relationship gains value at the expense of the other party. No new value can ever be created by this exchange-based (or rent-seeking) form of exploitation, which is premised mainly on plucking already-produced value from the pockets of others. Here are a few examples of how this happens:
-
Rent seeking: Extraction of rent from tenants by landlords for example, who capitalize their property, which includes land itself, by eating a share of the income of both residential and commercial tenants.
-
Ripping off consumers: Many forms of corporate, financial and regulatory crimes are a roundabout form of exploitation through market exchange, involving the reaping of extra value in exchange using deception, fraud, and other forms of capitalist malfeasance.
-
Financial exploitation: Exploitation of debtors by creditors, as owners of financial capital (think wealthy shareholders in banks, insurance companies, investment funds, and other financial sectors) squeeze value from working class people, smaller capitalists, and even entire countries, mostly in the form of interest payments.
-
Imperialism and colonialism: Unequal exchange is the norm on an international scale, where nations in the imperialist core (like Canada, the USA, most of Europe) benefit from value extracted from nations in the exploited Majority World or so-called Global South. Estimates vary greatly, but a significant portion of national income in countries like Canada come from such sources.
The reverse implication is that one may also be exploited in any of the ways above. So you are not only exploited by your boss, in that he pockets the surplus value you produce at work, but also by your landlord, the bank that owns your mortgage, your credit card company, and maybe even colluding grocery monopolists.
Introducing the concept of market income
Using a fuller concept of income, we can gauge exploitation based on the value of the total income received, instead of employment earnings alone. What is needed is an income concept that accounts for the fact that people can either gain or lose value through both market exchange and other forms of transfers.
Thankfully, this concept already exists and is commonly known as Market Income. Sometimes called income before taxes and transfers, market income is a measure of total income, before government transfers are accounted for and taxes are deducted, which includes:
-
Employment compensation, like wages and salaries;
-
Net self-employment or professional income;
-
Private pension income;
-
Investment income, like dividends or rental fees, but not capital gains;
-
Other miscellaneous sources like scholarships or certain retirement allowances.
For this analysis, we are only including people in the labour force that have worked at least 150 hours and have positive income in 2021. Those whose main source of income is either pensions or government transfers are excluded.
An important initial finding was that some people take in more value than they produce, not because they are exploiters, but because they are respectively, either (1) semi-retired and work very little, living mostly on savings or public pension payments; or (2) work very little and survive on punitively meager public transfers like social assistance or disability payments.
So there are other contextual factors to consider with regard to the value of income and class position. At this point, we are also not considering the impact of the tax system, which is another method of redistributing surplus value throughout society. Considering taxes would change the picture somewhat, but it would probably not be a drastic difference.
Measuring exploitation with the Canadian Income Survey
To account for many sources of income using real world data, we can turn to the public-use microdata file (PUMF) of the Canadian Income Survey (CIS), one of the main sources of data on the incomes of individuals and households in Canada. Switching over to the CIS, we gain more detailed information on all of the possible sources of income, as well as potential transfers of value like taxes or social welfare payments. In return, we lose out on knowing which industry people are employed in and what their occupation is.
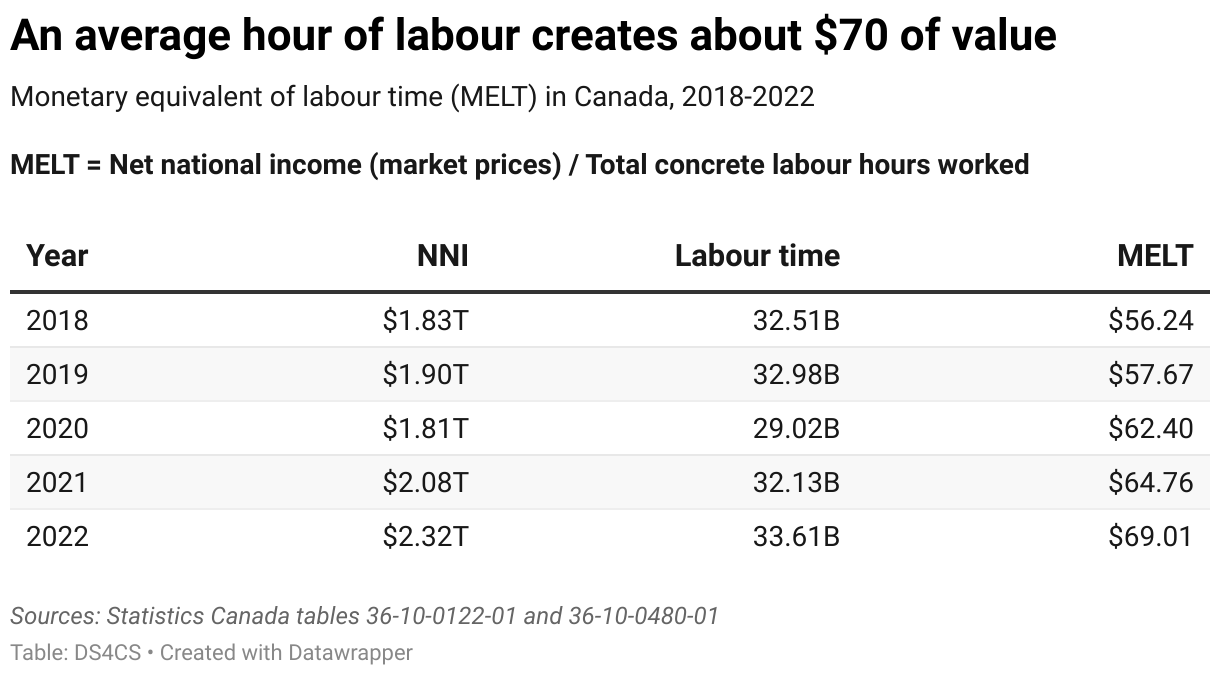
Multiplying the number of hours worked in the year by the monetary equivalent of labour time (MELT) of $64.75 an hour, we can make an estimate of how much value a person could have added with their labour in 2021.2 The MELT is the ratio that expresses how much monetary value an hour of labour adds to production and is calculated by dividing net national income by the total number of hours worked in an economy.
That means that in 2021, an average hour of labour in Canada created just under $70 in monetary value. An average work year of 1,601 hours would have produced about $109,000 in monetary value – the vast majority of people had incomes far below that mark.
Value added = Total hours worked * MELT
Dividing that labour value added by market income yields the value of market income or just income value for short. This ratio expresses how much value is captured in total income relative to how much value is added by labour time.
A person getting total income worth half of the value they created as a worker would have an income value of 50%. An income value of 100% indicates that a person is receiving the entire value of their labour, while a value of 200% indicates getting twice the value of their work back, and so on.
Income value = Market income / Value added
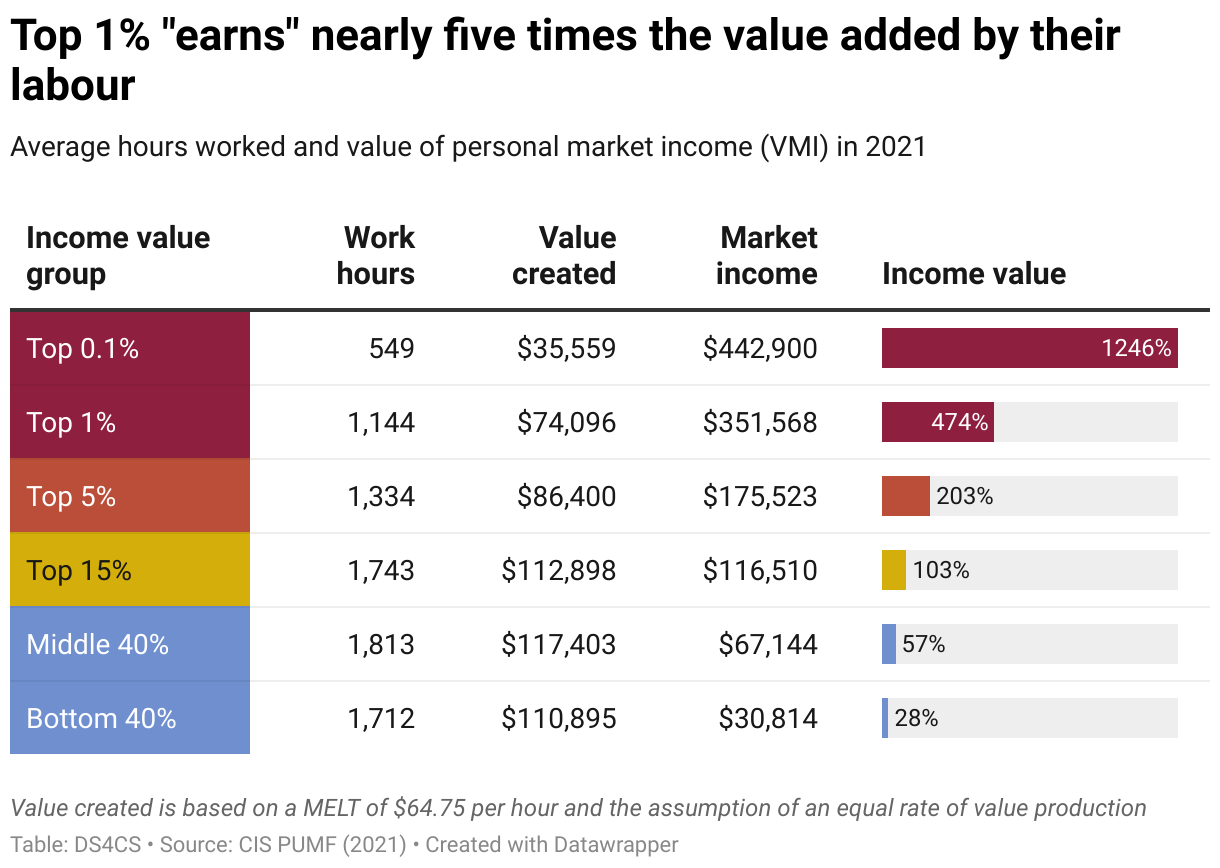
In the table below, the employed population of Canada (with a few minor exceptions) has been divided into groups based on the value of their market income. In terms of income value, the vast majority of people in the labour force face similar circumstances.
The bottom 40% in terms of income value – about 6.9 million people, the workers with the lowest wages in the country – were getting on average well under one-third of the value of their labour back in market income. The middle 40% on top of them – another 6.9 million people with average, but still modest incomes – were doing only marginally better with average incomes worth less than 60% of the value of their labour.
Only when reaching into the top 15 percent of the income value distribution do we see income begin to approach 100% of value added, meaning people are getting back the full value of an hour of labour in wages. Those in the top 1% of income “earners” had an average market income worth nearly five times the value potentially added by their labour, while the top 0.1% had incomes more than twelve times as valuable.
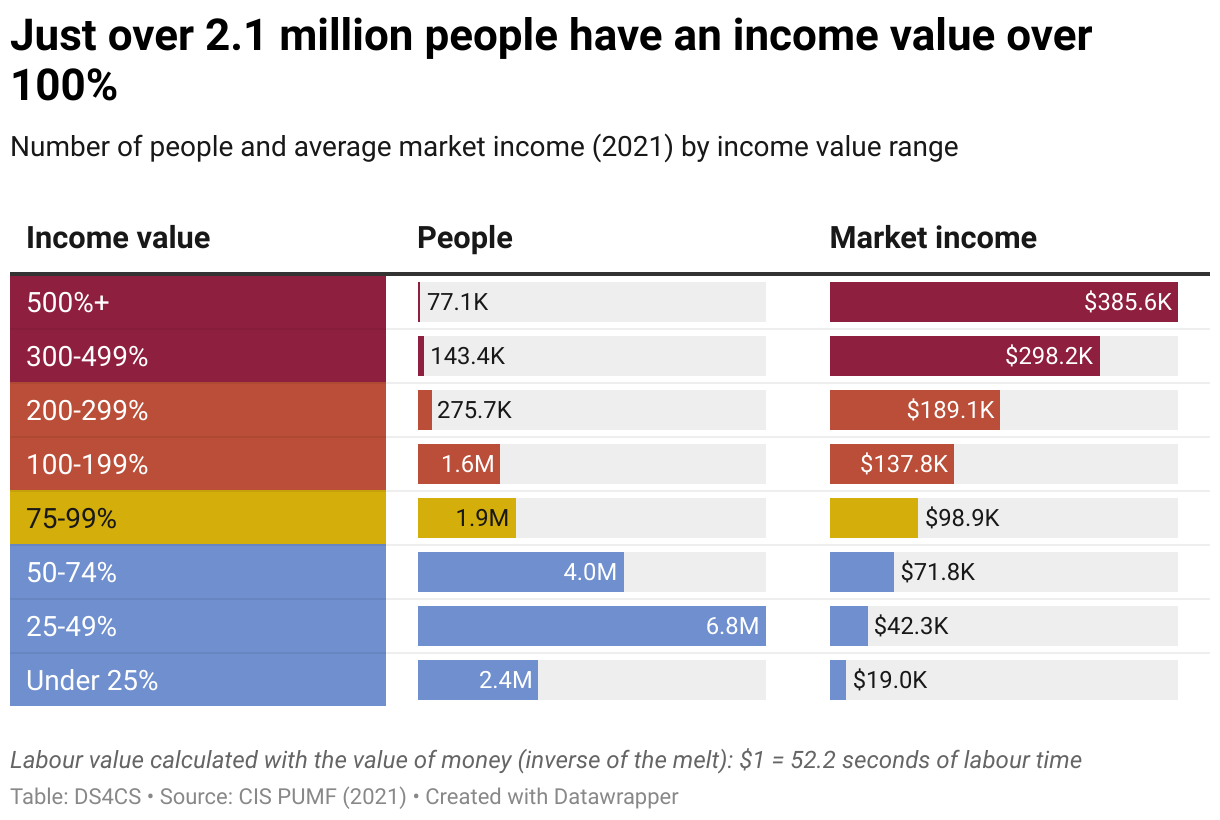
Below is another way of looking at the distribution of income values. This time, people are grouped by the income value range they fall into instead of quantile groups. The vast majority (87.6%) of people in the labour force who worked over 150 hours (15.1 million people) had an income value of under 100%. These people could be considered members of the exploited class(es), meaning their wages were worth less than the value added by their labour – and that surplus of value was pocketed by somebody else.
More than 9 million of those people, with average incomes in the range of $45K and below, were receiving wages worth much less than half of the value they created. There is – I suspect – some meaningful distinction, to look into later on, among the exploited workers at around the 75% income value mark, especially in the upper reaches of that range, where workers are still exploited, but have higher incomes and probably a higher material standard of living.
Just over 2.1 million people – a little over 12% of the labour force – had an income value of 100% or higher.3 In economic terms, these people are members of the exploiting class(es), in that they are getting back income worth more than they could have added with their work. It is a a small minority of people, but still far more than the previous estimate of around 500K people based on employment data from the Labour Force Survey.
Double dipping into surplus value
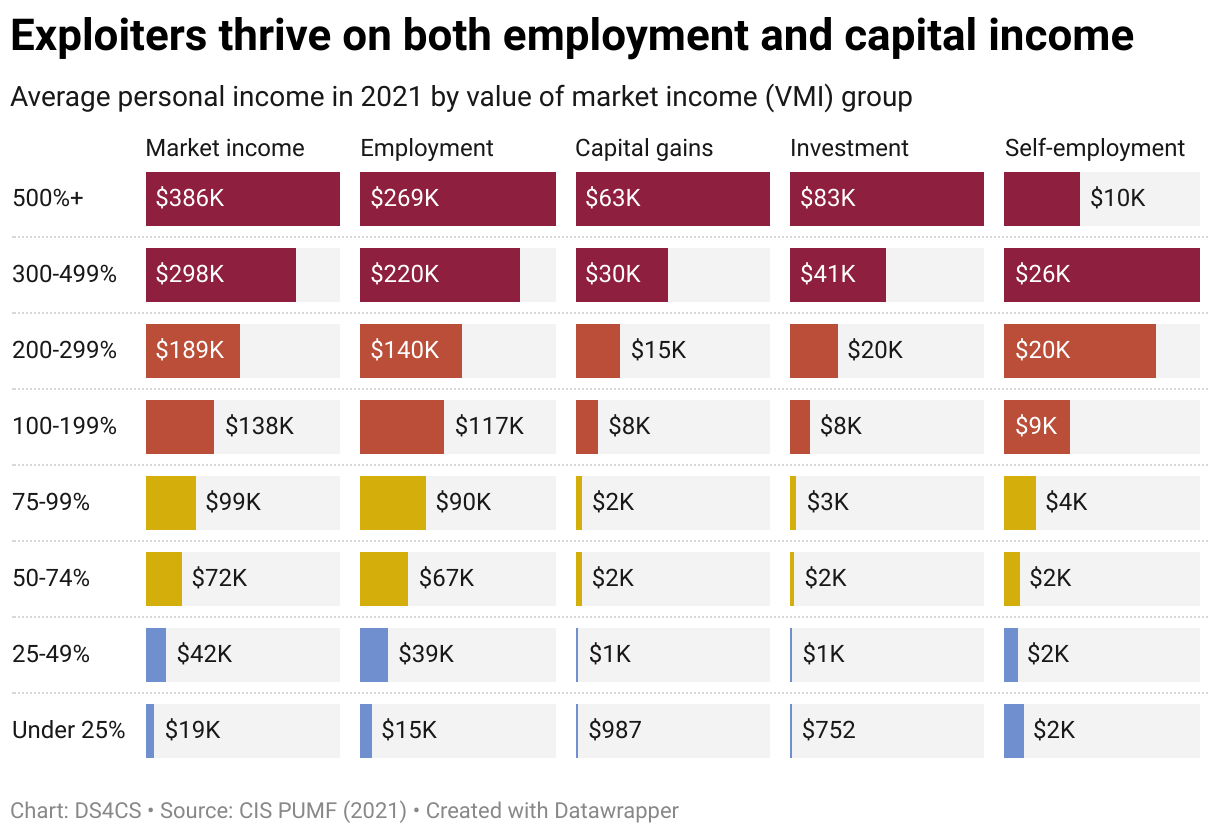
How are people taking in more value than they produce with their work? We can break down market income into it’s various components to shed some light on where they are getting that money from. The next chart displays the average values of many sources of income across the range of income values.
People with overvalued total incomes tend to have very high employment compensation. In fact, about two-thirds of exploiters surpass an income value of 100% based on their employment compensation alone.4 No doubt, many of these people are the highly paid professionals, specialists and managers highlighted in the previous analysis. This is the initial dip into societal surplus value – as at least part of the employment compensation of exploiters must actually be value produced by other exploited workers.
Investment income is the second dip into societal surplus value, which is produced by exploiting workers and then redistributed to the owners of capital by way of shareholder dividends, rental income, investment trust payments, and interest payments on things like bonds, loans, mortgages, or savings. There is a massive chasm of investment income separating people on either side of the exploitation line. Just 16% of people with income values below 100% receive any non-trivial (over $100) investment income at all, compared to 42% of exploiters.
Even then, the vast majority of small-time investors do not make serious money on investments. One needs to have money to make money, as it goes. To make a monthly income of just $1,000 in passive income, one would have to have about $180-200K invested in average return stocks that pay monthly dividends. It is very common for small-time investors to merely break even and they can easily lose small amounts of money rather than make gains.
Capital gains are profits from the sale of assets that have appreciated in value. If you buy a house for $500,000 and sell it for $600,000, you have enjoyed a capital gain of $100,000. The vast majority of people, owning no valuable investment assets other than (perhaps) a home, report little to no capital gains over the course of an entire lifetime.
Capital gains are so uncommon for most people, in fact, that they are not included in conventional measures of income – so they are extra income added on top of market income. Yet, regular capital gains are key to the incomes of those with very high incomes, who can afford to own valuable assets to sell in the first place and do so frequently. The higher income rises, all the way to the very top capitalists, the more important capital gains are as a source of regular income.
In the chart below, the distribution of total income between the exploited and exploiter classes is shown. The share of income from investment and capital gains diverted to exploiters is hard to understate. About one-eighth (12.4%) of people in the labour force took in well over half of all investment income ($31.6B) and capital gains ($25.6B) in 2021. Notably, they also received nearly half of self-employment income, despite only representing only 16% of self-employed people that year.

The commanding heights of income value
Our analysis has an important limitation with regard to the class structure of society. Since we are using a public-use microdata file (PUMF), it has been altered in many ways by Statistics Canada to protect the privacy of respondents. This is most impactful at the very top of the income distribution, where there are very few people with very high incomes – so much of the very top incomes in the country are capped at a lower value or have been scrubbed from the data entirely.
Consequently, the CIS can be used to produce solid estimates of incomes of the vast majority of people in Canada, but it underestimates the very highest incomes in the country by a significant degree. Thankfully, Statistics Canada does release income estimates for those with very high incomes based on administrative tax filing data.
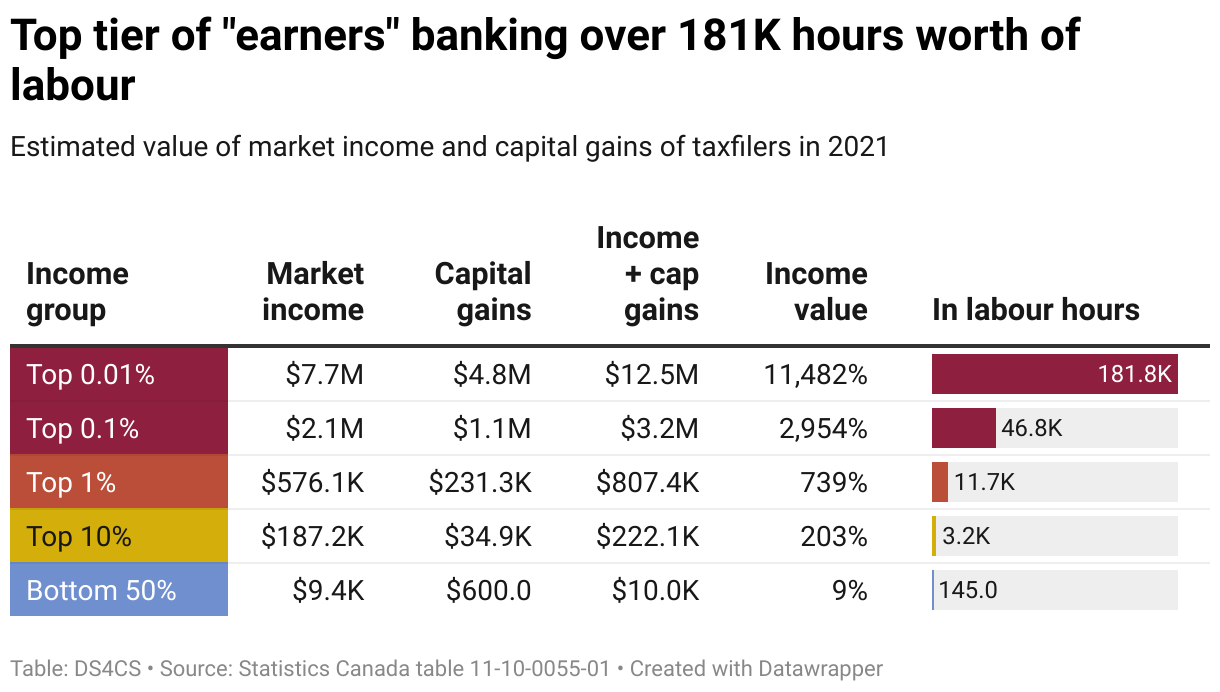
Based on tax filing data, the top 1% had market income of $567K, which is about twice as high as the top-coded estimates from the CIS. Those in the top 0.01% of the income distribution – under three thousand people in total – had market incomes three and a half times higher than the rest of the top 1% and over 700 times higher than those in the bottom 50% of incomes. When capital gains are included, the total incomes of the top 0.01% represented over 114 times more value than an average year of work created.
Recall from the last post that the MELT can be used to express amounts
of value in either money or units of socially necessary labour time. The
inverse of the melt (1 / MELT), often called the value of money,
expresses how much social labour time each dollar represents. In 2021,
the value of money was such that each dollar represented about 52
seconds of socially necessary labour time.
In terms of labour value, the average person in the top 0.01% had incomes worth over 182 thousand hours of social labour time. If a person worked an average of 1,650 hours a year over the course of 40 years, they would clock in about 66,000 hours of labour before retirement. So those at the very top of the income distribution took in nearly three lifetimes worth of labour value as annual income. For the first time in this analysis, we are getting a glimpse of the true capitalist ruling class of the country.
The story so far
Here’s the picture so far, then. If the mark of belonging to the exploiter class(es) is getting out more value than one contributes, then about 13% of people in the labour force, numbering about 2.3 million, could be counted as such – over 4.2 times as many people than using an estimate based only on employment income from the LFS. At this point, there are two major considerations.
First, is that we have not accounted for the role of the tax system and other transfers of value in the class structure of Canadian society. The tax system is one of the main methods of redistributing income and value throughout society. When we account for taxes, this picture will change somewhat, though it is hard to say by how much.
Further to that, we should consider exploitative transfers of value like extraction of rent. Should the rent you are forced to pay your landlord – a part of your income that becomes the capital and profit of someone else – be counted as part of the value of your income? Probably not!
Second, is that income and wealth are two sides of the same coin. Any consideration of income in this instance is incomplete without considering wealth and vice versa. People with exploiter-range incomes captured the majority of investment and capital gains income, despite only being about one-eight of the employed population.
To get a fuller view of the class structure of society therefore, we need to look into where that passive income is coming from. Passive income necessarily flows from owned assets, property with economic value that can be accumulated over time. It will be necessary therefore to look not just at class-based exploitation related to income, but also how it is tied to the accumulation of household wealth.
-
The MELT is the ratio that expresses how much monetary value an hour of labour adds to production and is calculated by dividing net national income by the total number of hours worked in an economy. That means that in 2021, an average hour of labour in Canada created just under $70 in monetary value, while the average worker received only about 45% of that value back in the form of wages. ↩︎
-
Here we are making the assumption that all employed people are producing value when they are doing socially necessary labour in the process of production. Though there has been considerable debate on this topic, in practice, it’s likely that not all labour is value productive. So many of the top earners, who tend to be much engaged in much more managerial labour and are employed much more so in financial and speculative industries, are probably not even producing at all. So their very high incomes might be technically counted as “employment income” in official statistics, but are made up entirely surplus value produced by workers. But that’s a complicated analysis to pull off using real world data, hence the simplifying assumption. ↩︎
-
If we remove the restriction of 150 working hours, that figure rises slightly to about 2.3 million. ↩︎
-
Only about 3% of paid employees had wages worth 100% of value in the LFS. One major reason this figure is so much higher is that the CIS treats some of the “labour compensation” of owners of incorporated businesses (their salaries, not dividend income from shares) as wages and salaries. In practice, some of that income might be genuine labour compensation, while another portion of it will be returns to owned capital. ↩︎